Friday, April 26, 2013

Day 34: Final Destination

Today is my last day at ASU, and my mentor decided that I practice my presentation in front of people who work in the lab during today's lab meeting. I was the only one who presented which made me feel bad for those who walked all the way to the conference room, but not a lot of people came, mostly because they had actual presentations to do. I was asked only one question, but was unable to answer it. Dr. Parikh answered it in lieu of me, so, if anyone else asks that question at my final presentation at school, I'll be able to answer it. Besides that, they all said they liked my presentation, which made me happy :)

 So seeing as this is my last day in the lab...

I would like to express my gratitude to all who have read this blog and journeyed with me these past 3 months.

I would also like to thank my superiors who have done so much to make this project possible. Specifically, Mr. Paul McClernon, Mrs. Elizabeth McConaghy, Dr. Marco Santello, and Dr. Pranav Parikh.

Wednesday, April 24, 2013

Day 33: Freaking Out

Here's a glimpse of my presentation that I have been working so diligently on (left). Last week, I mentioned to my mentor how this week will be my last week in the lab, so he suggested that I present my presentation to people in the lab. I seriously thought he was joking. This Friday, I will be giving a presentation to people I have either never seen before or never spoken to before. I am really nervous. Everyone here is really nice and all, but they all will secretly be judging me, and I know it. Luckily, my mentor is willing to help me fix up my slides and my speech. Hopefully that will be enough to compensate for the neuroscience knowledge everyone knows I don't have... I'm freaking out, as you can see. I really should give myself more credit, but everyone in this lab knows so much about the brain and TMS and experiments like mine that I'm afraid I'll appear inept. Everyone here is either a graduate student or a post-graduate scholar, so I'm terrified.

Negativity aside, there's really nothing else I have to say. Just need to add more notes to my presentation to read off of for my trial run Friday. Wish me good luck!

Monday, April 22, 2013

Day 32: The Beginning of the End

This is my last week interning here at ASU. And even though I'm picked on incessantly by Juan (a student graduating from ASU this spring who is sitting right behind me as I type this), my mentor, and everyone else, I'll miss everyone here, especially those who welcomed me so warmly.

Anyway, I just checked the calendar, and it seems I only have a week to finish my presentation. I'm way past halfway done, so no worries there. My final product is coming along as well so I have no complaints nor problems there either. Senior project aside, I have to make posters to advertise Prom, practice for the school concert that's tomorrow, practice for the Symphonette concert taking place Thursday morning, and study for AP Spanish. So I'm pretty busy...

But GOOD NEWS!
My blog has over 1000 views! That is amazing! Thank you to all of my readers, especially the faithful ones, who made this proud moment possible.

Thanks for reading!

Wednesday, April 17, 2013

Day 31: The End Is Near

Today, I was properly taught how to interpret the data into graphs. Turns out, I've been doing it wrong, so here are now my new, more comprehensible graphs (out of habit, I made the titles as detailed-yet-elegant as possible).


This graph illustrates the difference between the excitability values coming from the FDI (index finger) muscle. The two lines seem to be quite parallel until it reaches 1000 ms (when the Go cue appears). At 1000 ms, there exists a significant difference between the P-MEP values and the P+F-MEP values.


This graph illustrates something similar to what the above graph shows, except this is for the APB (thumb) muscle. It also shows a significant difference at 1000 ms.
  • Side note: We had to disregard some data points at 1400 and 1500 ms because data become really noisy. This is due to the fact that movement occurs approximately 300-500 ms after Go cue (which flashed at 1000 ms). 


Lastly, I created a ratio graph to see where the greatest difference between P and P+F occurred. Again, the significant values were at 1000 ms (disregarding 1400 and 1500 once more).


This all indicates that the corticospinal excitability (CSE) is task-dependent at 1000 ms. The comparison of CSE between P and P+F aims at determining whether the sequence of controlling digit position followed by force application is planned similarly to controlling digit position alone, and thus, my project has reached a conclusion.

Tuesday, April 16, 2013

Day 30: Pizza Party

The Minister of Social Activities in the lab planned out a pizza party for everyone who works in the lab. Everyone here is so kind, and I'm grateful that I was invited to enjoy pizza and conversation with them. Even the Director of the School of Biological and Health Systems Engineering here at Arizona State University was there! I seldom see him, which is disappointing since he is my mentor for this senior research project.

Speaking about my senior research project, I submitted my abstract yesterday to my adviser, Mr. Paul McClernon, who gave me really great feedback. Now I'm working really hard on the edits. The abstract is due tomorrow so wish me luck!

Friday, April 12, 2013

Day 28: Sick Day

I wasn't able to go to the lab today because I offered to stay at home to help my brother, who is at home sick. So I won't be able to attend today's Journal Club meeting.

For today, I've been working more on my abstract. Since the deadline is coming up quickly, I don't have time to finish my article before writing the abstract, so hopefully my abstract will turn out well. I have everything I want to say, but putting it all together elegantly is challenging.

What exactly do I do in this project? You've seen me post about TMS research, data analysis, and...that's basically it. The actually experiment tries to see if there's a difference in excitability of the finger muscles when planning to position the fingers (P) vs. planning to position the fingers and apply a force (P+F). To do this, TMS is used to stimulate the motor cortex and the EMG records the amount of muscle activity from that stimulation. The EMG also records the actual movement of the muscle that takes place approximate 500 ms after the Go cue (Day 25), but we only need the data of the muscle activity while planning for the movement. The objective is to better understand the relationship between the brain and the movement of the fingers. I hope to put something like this paragraph as my abstract.

In addition to working on the abstract, I've been analyzing the data more, hopefully creating decipherable, more simplified graphs. The graphs I made previously involve the 4 muscles we put electrodes on: FDI, APB, ADM, and FCR. 


But for this project, I only need to look at FDI and APB because the fingers associated to these muscles are the index finger and thumb, which act directly on the object during experiments.


So not much is happening today. Maybe I'll bake something with all this free time! Hopefully though, I'll be able to show more on my next blog post or in my final product and presentation!

Thursday, April 11, 2013

Day 27: Someone Stole My Seat...

... and my desk! So now I'm sitting on this too-comfy-to-be-comfy couch. Fortunately, I'm willing to overlook this obstacle and be productive today. I've been working on my abstract for my senior research project which is really quite challenging because of the fact that it should be terse. So to get the most important points of my project, I'm working on my final product which will be a little bit like an article. I remember in Capstone Physics, we wrote articles to get published and we would write the abstracts last because it's easier to remember the thesis once your thoughts have been arranged. So it's kind of a habit for me to write the abstracts last.
  • Side note: One of my friends from Capstone Physics, Jeff Milling, has been working really hard doing more research on nuclear fusion on top of his senior research project because his paper (which was co-written by Ryan Hearn) is actually really close to publishing! Absolutely brilliant work! I really hope you guys get published!
In addition, I've been reading another article for Journal Club tomorrow about the contralesional dorsal premotor cortex (cPMd) and what its purpose is after strokes. The study uses TMS and fMRI. TMS has been becoming very popular when being used to study strokes, which continues to intrigue me. The TMS is used for several different studies and treatments that it is becoming more versatile. It could be because the TMS is used to affect the brain, which controls everything in the body. I love the brain.

Thanks for reading my blog! 

Wednesday, April 3, 2013

Day 25: Organization and Orchestra

Everything is suddenly so clear! I can see the light at the end of the tunnel. We senior-project-doers have less than a month to complete our final product AND presentation, and fortunately, I've completed a detailed outline of both my paper and my presentation--so detailed that really all I have to do is paraphrase a few paragraphs, then copy from my outline and paste into my paper. I'm excited (as you should be) to see the outcome.

On the other hand, I will not be in the lab the next few days because I will be going to Disneyland along with all my friends in our school band/orchestra/instrumental ensemble. But hopefully I'll come up with an update for you tomorrow on this exciting new development!

In the meantime, since I learned more about it today, let me discuss with you a little bit about how trials are conducted.
P and P&F stand for Position and Position AND Force Application, respectively.
The image above contains all the cues needed to conduct our planning/preparation experiment. During these cues, the subject must remain as still possible since the data we need must be collected before they do the action. The cues light up in a similar manner as in the image below.
The location of the yellow dot is a lot more random though
There is only a second between each cue (except in between the Go → Ready cues because we must allow a reparation period). We use TMS between the Ready cue and within 500 ms after the Go cue to measure excitability. We continue collecting data 500 ms after the Go cue to allow the brain to process the visual information from the Go cue. TMS is used, in the case, to help measure the difference of excitability needed to position the fingers (P) and to position + apply force (P&F).

So now... I'm trying to analyze the data I organized yesterday. I'll post my discoveries next time!

Tuesday, April 2, 2013

Day 24: Numb-er from Numbers

I just finished compiling another set of data, resulting in this pretty graph! In addition, I've been working on my final product, which will either be in the format of a lab report or a research paper. I plan that my final product will consist of many of the topics I've covered in this blog (including TMS), but mainly, it will discuss the conclusion of this project.

So for this post, let me briefly explain what I do with the data. (Don't forget: You can click on images that seem illegible)


Step 1: Run Spike code
During testing, we collect data using the software, Spike. Spike also allows us to write codes that will do something with that data. In this case, we told Spike to create an Excel sheet of all the values it recorded. But what these values tell us is still unclear. In order to clarify all these data, we run these values through a code in Matlab.
Step 2: Run Matlab code
The Matlab code figures out what condition we cued for the subject (Column C: condition) and when we stimulated the subject with TMS (Column D: timings). The first two columns is what Matlab used to comprehend the data to create the "condition" and "timings" columns, but now they become irrelevant to me when finding the averages.
Step 3: Find averages
This image is of one block for one subject. Here, I find the average value of the MEP values for each condition at each TMS time. Then I divide each of the averages by the Baseline (in the image below).
By dividing the values by the Baseline, we find the normalized MEP values. The Baseline value is the threshold MEP value needed for the action. So we base all our data from the Baseline value. So as a result, I collect the image above from each block of each subject. Then I average the average normalized MEP values of each block for each subject to end up with this monstrosity (below)!
The average normalized MEP values of each subject.
Step 4: Make it look pretty
I take the average of all the values of the subjects and end up with this: a beautiful, simplified set of data and graphs. 
Later, I'll be analyzing data and taking standard deviations to find the error margin of all the data I collected. Thanks again for reading my blog!

Wednesday, March 27, 2013

Day 22: Stumbling upon Interesting Correlations

Taken from article.
Last night, while stumbling upon different science-related web pages through StumbleUpon, I found an article related to neuroscience! Tada! A Little Juice to the Brain Eases Depression. As I have discussed in a previous article, TMS is being used to treat depression and other mood disorders. This recently-published article talks not of TMS, but of transcranial direct current stimulation, or tDCS. What a familiar acronym! Where have I seen this before? Why, in one of my previous blog posts: "Day 12: Defense against the Dark rTMS." In my blog post, I read about how tDCS is used to negate the negative effects of rTMS.

In the article that I "stumbled upon," the experiment compared the affects of antidepressants vs. tDCS and found that tDCS was significantly better at treating depression than antidepressants. But the two together was found to have worked the fastest in treatment and was said to have had significant improvement by week 2.

The article I'm reading!
So now, I'm reading an article for Journal Club even though I will be absent Friday to visit the venue for Prom and to go to church for Good Friday! Anyway, the article is titled "Differential Modulation of Motor Cortical Plasticity and Excitability in Early and Late Phases of Human Motor Learning." I'll discuss more about it once I finish reading it.

For clarification: If you were wondering why the number of "Day"s is so small even though I've been at this for almost 2 months, the Day number is actually a day I'm in the lab. So, I've been in the lab for 22 individual days. I've been consistent, arriving here at ASU 3 days a week at 8am and starting work at 9.

References:
  1. Phend, C. "A Little Juice to the Brain Eases Depression." MedPage Today. 26 Feb 2013. http://www.medpagetoday.com/psychiatry/depression/37226?rXFb&xid=su_&hr=su&utm_source=stumbleupon&utm_medium=cpc&utm_campaign=psyc&rQZb/ (accessed March 25, 2010)

Tuesday, March 26, 2013

Day 21: Planning Data

Not much has been happening recently... But I have been making progress towards my final product.
click to enlarge

Today, there are high school students all around the lab taking a tour, so we're not doing any experiments or anything. I took this free day to import all the planning data for my project into my computer. It took me less than an hour to run the code for 7 subjects (6 blocks each) using the software Spike. We use Spike to view the muscle activity as MEP values and to create Excel spreadsheets with all the data (as shown to the right). Each column represents a different variable that will become apparent once the data goes through MatLab. Columns C, D, E, and F represent the MEP values for the muscles FDI (index finger), APB (thumb), ADM (pinky), and FCR (forearm), respectively. 

Looking through some data, I've seen a trend suggesting that positioning the fingers (P) requires surprisingly more excitability then positioning + applying a force (P+F). I originally expected to find that there wouldn't be a difference in excitability between the two because the movement for each action involves the same muscles. What I did not take into account is that the two actions are controlled by different parts of the brain. But in reality, excitability of P is greater than that of P+F. This is due to the inhibition of force application. During planning, the action of force application is inhibited because the action is more intense than just positioning the fingers. 

Something important to always keep in mind when reading this blog: This entire project is based on planning dexterous movements, which is why I imported all the planning data. Planning is the period after the cue (P or P+F) is given but before the movement is actually done. Related experiments that also use TMS focus on memory, learning, consciousness, and emotion (click here to learn more).

Thanks for reading my blog!

Saturday, March 23, 2013

Day 19: Another Day, Another Article

It was Friday yesterday which is Journal Club day! The article we read this week was titled "Action-blindsight in healthy subjects after transcranial magnetic stimulation." For those of you who don't know, blindsight is a condition caused by a lesion in the primary visual cortex, so it makes people blind in one side.

For methods, the experimenters used 11 subjects. The subjects sat in front of 3 buttons: Left button (LB), middle button (MB), and right button (RB). A subject was cued to move his or her hand to MB, and sometimes, a second cue would show up to correct them to either go left or right, which was chosen at random. The TMS had to be pulsed at a specific time period so that the subject could exhibit blindsight behavior. The TMS pulse caused the correction speed to decrease, which suggests the existence of an efference copy. This is a weird concept--a theoretical construct. Efference copy allows people to predict the effect of their movements. It enables a person to know the difference between actual movement and desired movement while the person moves. The action potentials for the movement don't have to go through an entire neural pathway, so it's like a shortcut, which is why in the experiment, the time taken for the subject to realize he or she have to correct his or her hand direction usually was lower than the amount of time the subject took to process the movement towards MB.
  • Fun fact: Have you ever tried tickling yourself? Most people are incapable of tickling themselves. It's a strange phenomenon caused by efference copy.
The study showed that TMS blocks conscious perception of the object placed on the blind side. Subjects of the trial claimed that they could perceive color spheres. But fortunately, TMS only INDUCED the blindsight behavior, so blind sight was not caused by injury or trauma. This reminds me of a kind of stimulation I've mentioned in a previous post: cTBS, a stimulation capable of creating virtual lesions. Crazy stuff, right?

Until my next adventure!

References:
  1. Christensen, M.S.; Kirstiansen, L.; Rowe, J.B.; Nielsen, J.B. Action-blindsight in healthy subjects after transcranial magnetic stimulation. PNAS. 2007, 105, 1353-57.
  2. Wikipedia - Efference copy

Thursday, March 21, 2013

Day 18: Round Is Just Not My Type

This post will complete my 3-part discussion on the TMS. So, without further delay...

Part 3: TMS Coils
There are different types of TMS coils for different purposes. The properties of a coil depends on three things:
  1. The geometric configuration of the coil
    • Here are some examples of different coil shapes:
      • round - the original coil shape
      • figure-eight - what we use in the lab
      • double-cone - used for deep stimulation (compared to superficial or surface)
      • four-leaf - stimulation of peripheral nerves
  2. The material that makes up the coil
  3. The characteristics of the pulse the coil emits.
We use our coil for the stimulation of the surface of the brain because primary motor cortex is a superficial area of the brain.

Here are different coils Magstim sells (http://www.magstim.com/search?keywords=coil).
List compiled from the search results of "coil" from Magstim
Reference:
  1. Magstim
  2. Transcranial Magnetic Stimulation. Wikipediahttp://en.wikipedia.org/wiki/Transcranial_magnetic_stimulation (accessed Feb 19, 2013).

Friday, March 8, 2013

Day 15: Why Not Use TMS?

Welcome to day 2 of my 3-Day discussion of TMS. Since it's Friday, today's post will be nice and sweet. So sit back in this comfortable-looking chair and relax!

 
In my past posts, I've discussed some of the therapeutic and experimental applications of TMS. So TMS sounds like a pretty nifty thing, right? Why not go to your doctor right now and demand TMS treatment? I'm only joking. Before you sign up for a TMS session, read on and discover the risks of TMS.

Part 2: Risks
Here is a list of some of the risks from using TMS.
  1. Seizures and syncope. Seizures from TMS are said to be caused by single-pulse or rTMS. The risk of getting seizures today though is "very low" (Wikipedia). 
  2. Discomfort or pain. Appears at locations of stimulation on the scalp. Discomfort is more associated with rTMS than with single-pulse.
  3. Hearing diminishes. TMS can emit very loud clicking sounds that can affect hearing after long periods of time (so it's associated more with rTMS), but this can easily be avoided through the use of hearing protection.
  4. Skin burns. This may seem odd, but remember on Day 9 when I attached electrodes to myself to measure data? Well, when rTMS is near incompatible electrodes, it may cause damage to the skin.
So now that you have become more knowledgeable about TMS, you can weigh the benefits vs. the risks before being involved in the TMS therapeutic applications. Stay tuned to hear about the different coil types for TMS!

References:
  1. Transcranial Magnetic Stimulation. Wikipediahttp://en.wikipedia.org/wiki/Transcranial_magnetic_stimulation (accessed Feb 19, 2013)

Wednesday, March 6, 2013

Day 13: Techniques and Risks and Coils, Oh My!

http://www.teamworksdesign.com/our-work/magstim/
This image can be seen in "Photo Gallery: The Lab"
Magstim, as it states in the image, is "the leading provider of advanced neurostimulation products." The TMS machine we use in the lab was actually created by Magstim. How did I not think of going to their website before! I found Magstim's wonderfully informational website and will be using it as another source for my present and future TMS discussions on this blog.

So to cover what I have discovered over the past week, I will create a 3-day series, talking about the different techniques, risks, and coils of TMS--one subject for each day. Let's begin.

Part 1: Techniques
http://www.magstim.com/techniques/
To the left is a compiled list of different ways TMS is used in research. To not cause confusion, I'll discuss only the techniques relevant to my project, indicated by the red stars. 

Brain Mapping-MRI: fMRI measures neural activity by looking at changes in blood flow activity. fMRI provides great visuals, but it is unable to indicate "whether activation within a particular cortical region is directly related to perception or behavior" (Magstim). By adding TMS, we can make those correlations between region and perception or behavior. Moreover, fMRI can be used to find areas affected by TMS through either direct stimulation or stimulation from an interconnected area.

Motor Evoked Potentials: The first to stimulate the brain through a noninvasive procedure were Merton and Morton. Why stimulate the brain? To observe what happens. With TMS, a small area of the brain can be stimulated to see what that area does. 

Inhibition and Excitation: Excitability thresholds increase among stroke victims, making it harder for muscles to be excited. TMS can enhance the excitability threshold when stimulation comes prior to voluntary movement.

References:
    1. Magstim
    2. Merton, P.A.; Morton, H.B. Stimulation of the cerebral cortex in the intact human subject. Nature. [Online] 1980http://www.nature.com/nature/journal/v285/n5762/abs/285227a0.html (accessed March 6, 2013).
    3. Wikipedia - Functional Magnetic Resonance Imaging

Friday, March 1, 2013

Day 12: Defense against the Dark rTMS

Happy March! Today, I spent the lovely day inside the lab, reading. The reason I have to read different kinds of articles is to learn different TMS techniques. So I read an article for our Journal Club titled "Low-Frequency Repetitive TMS Plus Anodal Transcranial DCS Prevents Transient Decline in Bimanual Movement Induced by Contralesional Inhibitory rTMS After Stroke." So what does that mean? Let's start with a little review.

Last post, I talked about modes of TMS, and rTMS was one of them. rTMS is not "dark" as suggested in my title. In fact, it is used for therapeutic applications, such as after strokes. In strokes, parts of the brain are affected and disabled. For the subjects in this article, one side of the brain was affected, and when one side of the brain is disabled, the unaffected half of the brain works harder to compensate for the missing parts in the other side of the brain, basically working for those disabled areas. The brain's ability to adapt such as in cases like these is called neuroplasticity. So when stimulating the unaffected side with rTMS, the stimulation is seen also in the affected half of the brain. The reason they used the rTMS on the unaffected side was to increase the neuroplasticity, so this is a treatment for stroke patients.

But rTMS has a dark side. It has a negative effect on bimanual movement, decreasing the ability for a person to move both hands. To negate this effect, transcranial direct current stimulation (tDCS) was used. tDCS is not a type of TMS. In fact, tDCS is weaker than TMS and is less prone to cause seizures (to learn more about tDCS, click here). The tDCS was able to counteract the bad side of rTMS, allowing the subjects the ability of bimanual movement.
This picture illustrates the effect of the tDCS against rTMS, as I had stated above. (Picture taken from article)
References:
  1. Takeuchi, N.; Tada, T.; Matsuo, Y.; Ikoma, K.Low-frequency repetitive TMS plus anodal transcranial DCS prevents transient decline in bimanual movement induced by contralesional inhibitory rTMS after stroke. Neurorehabil Neural Repair  201226: 988-999.

Wednesday, February 27, 2013

Day 11: As Thorough As Airport Security

I always hear jokes and stories about TSA agents and how they are very thorough when it comes to searching people. Similarly, I have molested Google, searching for a response to "What is TMS?" After more searches I found two websites other than Wikipedia that are informational about the TMS, and both are of great universities: University of Pennsylvania and Johns Hopkins University. These two universities actually offer TMS services to treat people with neuropsychiatric disorders. I don't know though if this service is limited to students only or available to the public. But if you'd like to learn more, here are the links to their websites:
  1. http://www.med.upenn.edu/tms/overview.html
  2. http://www.hopkinsmedicine.org/psychiatry/specialty_areas/brain_stimulation/tms/index.html.
Back to TMS...

Image belongs to Johns Hopkins Medicine
TMS stands for transcranial magnetic stimulation. It is a noninvasive procedure that stimulates areas of the brain through electromagnetic induction. A weak electric current is induced using a coil that "generates short magnetic pulses," similar to those of an MRI machine, that are able to go through the surface of the head and into the brain (Johns Hopkins Medicine). Because of the electromagnetic induction, the coil only needs to rest on the scalp. The image to the right is an example of TMS being employed on a patient.

There are two modes of stimulation: Single or paired pulse and repetitive.
  • Single or paired pulse TMS is what my project uses. This mode of stimulation discharges an action potential and, if used on the primary motor cortex (M1, refer to Day 6), it produces muscle activity, which we measure as MEP (motor evoked potentials).
  • Repetitive TMS (rTMS) is used more for therapeutic applications, treating neuropsychiatric disorders. The two universities, UPenn and Johns Hopkins, use this mode of stimulation for treatment. rTMS has effects that last longer than single/paired pulse TMS (Wikipedia).
There are so many more exciting things to learn about TMS that relates to my project, such as risks, techniques, and different kinds of coils, but I'd like to research more so that I will be able to explain it to my readers. Feel free to comment any questions. Until next time!

References:
  1. Transcranial Magnetic Stimulation (TMS) Service. Johns Hopkins Medicinehttp://www.hopkinsmedicine.org/psychiatry/specialty_areas/brain_stimulation/tms/index.html (accessed Feb 19, 2013).
  2. Transcranial Magnetic Stimulation. Wikipediahttp://en.wikipedia.org/wiki/Transcranial_magnetic_stimulation (accessed Feb 19, 2013)

Thursday, February 21, 2013

Day 9: Thumb's Up

Yesterday was especially exciting because I was allowed to play around with some of the equipment! The instruments that I used were the ones that measured muscle activity/excitability by measuring the voltages of finger muscles with electrodes (the black thing shown on my palm on the right and another shown on the back of my hand in the image to the left). To find where the muscle is so you can attach the electrode, you tense up the muscle. The muscles that I examined here are the first dorsal interroseus (FDI) and the abductor pollicis brevis (APB). Both of these muscles function to abduct (or move away from the body) the index finger and the thumb, respectively. The picture on the left above shows me abducting my index finger and stopping it with my thumb to emphasize the location of my FDI muscle where my FDI electrode is placed.

After setting up the system and running the program, I let the computer record the motor-evoked potentials (MEP, measured in millivolts) in those two muscles. The monitor displays these values on a graph of MEP vs. time. The top bumpy line measures APB activity and the bottom FDI. Throughout the time period during which I recorded data, I maintained a steady rhythm abducting my fingers, making it seem like the muscles had a steady pulse, as illustrated by the graph.

After abducting and resting and abducting and resting and abducting and resting these muscles for at least 5 minutes, I decided that I should add another finger muscle! So I end up adding my abductor digiti minimi (ADM), the abductor muscle of the pinky. I tape the electrode on there as shown in the picture below. It was around this time that one of my mentors tell me that people test the equipment on themselves before testing on others. I think he was trying to tell me that I'll be able to test on people! Not really. I wish he were though. The entire thing was quite informational for me.


Anyway, so the electrode is now attached to my FDI, APB, and ADM. What's that on your wrist? you might ask. Well that is a "dermatrode." I think it's an electrode that is used as a control for the muscle activity measurements. There might be extraneous movements in other muscles affecting the muscles being measured so this helps remove those anomalies. So here is an image of the graphs (to the right). The first static-y line represents the MEP of the ADM, second APB, third FDI. ON TO THE ABDUCTING (of muscles, not people).

Take note of the background image of the graphs. The monitor shows the graph in real time so the x-axis (time) moves, so the graphs are created from the right side of the monitor. More black you see on the graph = More abduction action.


ABDUCT ALL THE FINGERS


rest


Look at the very right side of the screen


ABDUCT 


rest 


Thumb abduction


Index finger abduction


Pinky abduction
After I was done abducting my fingers, I put everything back. The clean-up was as easy as the set-up. So that's how we collect data from the trials! All the equipment--everything in the picture except the tape--is really expensive, and I'm very grateful that I was given the opportunity to experiment with them.

And now, I continue my search for information of how to use the TMS. A significant majority of the websites that I have found always state how the TMS is a therapeutic tool that is now mainly used to treat major depression. Although they are really interesting, they do not relate to my project nor do they mention how and why the TMS is used to stimulate muscles or to locate areas in the brain or even how/why is it used in experiments. Why is that stimulation necessary to obtain results? These are the questions I'm searching the answers for. Wish me luck on my arduous journey.

Tuesday, February 19, 2013

Day 7: Brains!

I've recently taken a liking to a movie/novel called Warm Bodies by Isaac Marion (I'm currently reading the book after watching the movie twice (Yes, yes. Shame on me for seeing the movie before reading the book)). In the story, brains are the best part to eat for zombies, because by eating the fresh brain, the zombie collects the memories and emotions of the brain's previous owner, making them feel, for a little while, more human.

But how does this relate to my project? Well, the fact that it has to do with brains! With my project, the brain is stimulated through transcranial magnetic stimulation (TMS). Hypothetically, I can stimulate a part of your brain that controls your hand using this procedure, moving your fingers as a result. We use this methodology to find the amount of voltage needed to move the finger muscles. Before I could be a part of this project, I had to spend a month reading chapters about human ethics so that I can be allowed to analyze data. I'm not experienced enough (or probably old enough) to use the TMS on humans but I was taught how to use it, which is impressive in itself.

So I had decided to dedicate this week to reading articles and publications referring to Transcranial Magnetic Stimulation--how the procedures goes, what is involved, MagStim, the difference between single and paired pulse, if there's a difference between rTMS and TMS. I realize that I really should know more. How do I not know more about how TMS works?

I first begin at Google, where everyone student begins. "What is Transcranial Magnetic Stimulation?" I type in the Search bar. What results is the typical Wikipedia  page which actually turned out to be pretty helpful , but unfortunately, Wikipedia  is not known to be a reliable source. So I continue on, but my findings are fruitless. Nothing except for Wikipedia  tell me how the procedure of TMS goes. All refer to the TMS as a treatment or therapy to mental disorders, especially major depression. I release a big sigh and renew my Search bar. "How to use transcranial magnetic stimulation," "The procedure of transcranial magnetic stimulation," "rTMS vs. TMS," "Single vs. paired pulse transcranial magnetic stimulation" (feel free to leave any suggestions in the Comments). Fortunately, I find a few good points on Johns Hopkins University's (my dream school) Medicine website, hopkinsmedicine.org. It wasn't quite futile, yet it wasn't substantial either. I try looking up the references Wikipedia  used for some informational points I found, and I come upon a book which I was excited to read until I saw the price tag on Amazon. $350.00 for a USED  book. Words cannot describe my anger and disappointment. So many questions that remain unanswered. I remember why I don't know much about TMS now.

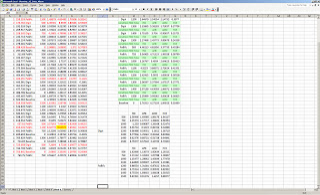
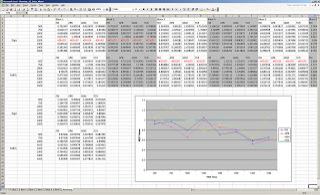
PROOF! (click to enlarge)
The search continues...

Wednesday, February 13, 2013

Day 6: Speed of Light Rail

Today marked the first day I used public transit on my own! Despite what its name suggests, the Light Rail does not travel the speed of light. It wasn't very exciting, but it does feel nice having a little more independence. I took a bus ride downtown to where my dad works then took the Light Rail all the way to ASU's Tempe campus.

So what did I learn today? I finally finished that article I started Monday. It studies the significance of the primary motor cortex in humans. The primary motor cortex is located in the green area of the image of the human brain below.


The motor cortex is also labeled as M1 in many instances. The primary motor cortex is the key component for the "storage and processing of new motor information" (Muellbacher et al. 643).

Now remember in my post, "Day 2: An Unexpected Turn," how I mentioned we hypothesized that the PMd and PMv are responsible for force application and positioning, respectively. What I highlighted above in the brain picture are those two areas in the brain. The red is the PMd. The blue PMv. I'd just like to point out a problem that could occur during the experiment. Notice how the PMd (red) is very close to M1 (primary motor cortex). Because of this, instead of stimulating the PMd, which is a small area in the brain, the motor cortex would be stimulated.

There's so much to say about my project that it's really hard for me to only post twice a week, but at the same time, I don't want to overwhelm you, my beloved readers. I will be in Chicago Thursday and Friday so today is the last day of this week I will be in the lab. I'll be back Monday. Thank you for reading!

References:
  1. Muellbacher, W., Ziemann, U., Wissel, J., Dang, N., Kofler, M., Facchini, S., Boroojerdi, B., Poewe, W., Hallett, M. Early consolidation in human primary motor cortex. Nature. [Online] 2002. 415, 640-644. http://www.nature.com/nature/journal/v415/n6872/full/nature712.html

Tuesday, February 12, 2013

Day 5: Numb from Numbers

Did you know the brain has no pain receptors? So during brain surgeries, you're wide awake...

I spent this morning analyzing data using Excel spreadsheets! Oh the joy from putting numbers together using Excel functions and getting new numbers to put together to get new numbers. It didn't take me long though--about an hour for 2 Excel documents filled with data. Each Excel document had 6 books, one for each "block," which represents the time in which the subject was not taking a break. During testing, in between each block was a break period for the subject for him/her to relax.

Image intentionally made illegible for confidentiality reasons.
The red font represents data that just wasn't good enough.
This is a snapshot of the Excel document showing Block 6. For each block, I use all the data on the left and average the MEP values for different sets of conditions, different sets of times where the TMS pulse came in, and for each muscle. The 3 times of conditions are Digit (position), Pa&Fc (position and force), and Baseline. And the different times for the TMS (TMS time) are 500, 750, 1000, 1100, 1200, 1300, 1400, 1500 ms. The main muscles examined in the trials are the index finger muscle (FDI), the thumb muscle (APB), and the forearm muscle (FCR). The pinky finger muscle (ADM) was also examined as a control. The light green in the image contains the averages at every possible combination of condition and TMS time for each muscle. Below the green are the normalized MEP values. Normalized MEP values are divided by the Baseline so they're a percentage. 

This process is repeated for all 6 blocks and compiled into a Summary chart (below).

Image intentionally made illegible for confidentiality reasons.
This image contains all normalized MEP values from the 6 blocks (on top half, white and gray, copy-pasted from each block). The data to the left of the graph are the averages of the 6 blocks' normalized MEP values for FDI, APB, ADM, and FCR at each TMS time interval. The graph is a representation of the average normalized MEP values. This was my main task, which was actually easier than I expected it to be. I only needed to insert formulas and operations into the cells (the boxes in Excel) and expand it to apply it to other cells, so it was really like a copy-paste task. I question if they actually need me to do all of that or if they don't think they'll need me for anything so they instead give me what they think is busy work. It was actually fun learning about how Excel works, and I can add that to my resume.

I'd say I've done enough work this morning, and now it's time for lunch!

Monday, February 11, 2013

Day 4: To the Laboratory!

If you caught my "Dexter's Laboratory" reference in my title, I'm impressed! Kudos to you.

On Day 1, I mentioned how I had to read about if TMS and fMRI can predict the outcome of a hemispherectomy for Friday. The article was a case study of a 14-year-old girl with cerebral palsy and untreatable epilepsy. When we discussed the article ("Unaffected motor cortex remodeling after hemispherectomy in an epileptic cerebral palsy patient. A TMS and fMRI study"), the Journal Club came to the conclusion that it was inaccurate due to its inconsistency in testing. For example, when comparing the pre-operative fMRI study and post-operative fMRI study, they used two different tasks. For the pre-operative study, they obtained the results during a right hand finger-tapping task, but for the post-operative study, they obtained the results during a repetitive thumb-last finger tapping (Pilato et al. 248). It would be helpful if they had mentioned why they changed the tasks. Maybe the girl couldn't move one of her fingers after the surgery? I wasn't able to fully understand the article because (1) it had words and abbreviations that I had never learned before and (2) it wasn't very consistent with its testing.

So Day 3 was a very busy day. Before Journal Club at 12:00 pm, we had a lab group meeting in the conference room at 9:00 am. Many of the 14 people that attended I've never met. I did not know about this meeting until the moment I arrived at the lab. In these meetings, we discuss other people's projects and see if we can improve or help them in any way. It was quite interesting learning about other projects being done here. Now that I think about it, I've never really said much about the actually lab here at ASU.

I do not own this picture. 
This is Physical Education East, or PEBE. I've pondered on the use of the B in the abbreviation, since most buildings here at ASU don't have B in their abbreviations, but I'd like to think it's because if the B weren't there, the initials would spell "pee." So I came to the conclusion that B stood for building. The PEBE is located on Terrace Rd. and is just a 5-minute walk from Memorial Union. This building used to be for the Engineering department, but when the Engineering department moved, the building was converted into the ASU School of Dance. The reason why I go here is because the labs are still in this building. So now, we're here.
I do not own this picture.
All the projects done in this department investigate motor control in a variety of situations: how it relates to the brain, how can it be improved, how certain mental illnesses affect it. The lab I work in is filled with friendly students, and I even have my own desk! But I can't get to it because I don't have a key to any of the doors here. (Look at my Photo Gallery for pictures!)

So back to today... Day 4 will be spent reading a new article: "Early consolidation in human primary cortex." I haven't started reading it yet but it seems to be easier to understand than the last one. Since I won't be here Friday, I won't be able to attend Journal Club, and therefore, I won't be able to discuss with you the credibility of the article in quite as much detail as the Journal Club does. 

References:
  1. Pilato, F., Dileone, M., Capone, F., Profice, P., Caulo, M., Battaglia, D., Ranieri, F., Oliviero, A., Florio, L., Graziano, A., Di Rocco, C., Massimi, L., Di Lazzaro, V. Unaffected motor cortex remodeling after hemispherectomy in an epileptic cerebral palsy patient. A TMS and fMRI study. ELSEVIER. 2009 85, 243-251.

Thursday, February 7, 2013

Day 2: An Unexpected Turn

In my last post, I mentioned how what I thought I would be doing isn't what I will be doing over the next few months. The difference in excitability of the motor cortex for planning position (P) versus planning the application of force along with position (P+F) was seen in the "pre-experiment," where the results showed that the MEP (motor evoked potential) values of P were higher than those of P+F. Additionally, the MEP values of both variables showed inhibition (the difference of the MEP values from the Baseline), which takes place during the planning. There are a few questions we will try to answer with this new experiment following up this "pre-experiment." Why is there a difference in the excitability between P and P+F? Is it due to different inputs or different gain from the same input? Why do we see inhibition? 

We hypothesize that two areas of the brain--the dorsal premotor cortex (PMd) and the ventral premotor cortex (PMv)--are the two areas that we should be focusing on. PMd has been linked to arbitrary force cues and associative learning. It has also been seen to be responsible for the delay in hand transport by the forearm muscle and temporal relationship between gripping an object and lifting. PMv is said to be linked to the difference between planning the position of 2 fingers (index and thumb) and the whole hand. So to see if PMd and PMv is responsible for planning force application and position, respectively, we inhibit each of the areas using the TMS!

This is where it gets really exciting!

We will use continuous theta-burst stimulation (cTBS), "where TMS bursts are applied at a frequency of 5 Hz over a period of 20 or 40 s," causing a decrease of MEP values (Gentner et al., 2007). In other words, the cTBS is a type of TMS that temporarily shuts down an area and creates a virtual lesion. When I mentioned this to Jeff today at lunch, he responded, with a worried face, "Imagine trying to grab and object and your hand gets there. 'Oh my gosh I can't squeeze the object!'" It's almost really just that.

So when we disable the PMd, ideally, we would like the results to show this.

Click on image to enlarge
By disabling PMd, which we hope will remove the force application (F=0), we would expect the MEP values of P and P+F to be equal.

Likewise with PMv and position.

Click on image to enlarge
By removing the ability of planning the position of the digits, we would expect the MEP values of P to be at the Baseline, meaning that there was no excitability nor inhibition. P+F would increase since there will be no inhibition caused by the planning of digit positioning.

However, because of the sheer complexity of the brain, our expectations could be completely off. The MEP values of P+F could possibly turn out greater than those of P. Because of all these possibilities and unpredictability, our hypothesis may be wrong.

I will continue to update you more on the change of my focus of my research project. If you want to learn more, feel free to leave me a question (or questions) in the comments.

References:
  1. Gentner, R., Wankerl, K., Reinsberger, C., Zeller, D. Depression of Human Corticospinal Excitability Induced by Magnetic Theta-burst Stimulation: Evidence of Rapid Polarity-Reversing Metaplasticity. Oxford Journals. [Online] 2007 2046-2053. http://cercor.oxfordjournals.org/content/18/9/2046.full (accessed Feb 7 2013).